The Opioid Crisis In 50 States

Illicit Drug Overdose Data By State
The State Health Access Data Assistance Center (SHADAC) published data highlighting trends in drug overdose deaths per state from 2000-2017. The data examines variations in both the prevalence and types of opioids associated with reported deaths during the 7 year time-frame. These state specific infographics offer a helpful resource in identifying the dangerous impact the drug abuse epidemic is having throughout the nation at the state level.
1,905
44,659
3,068
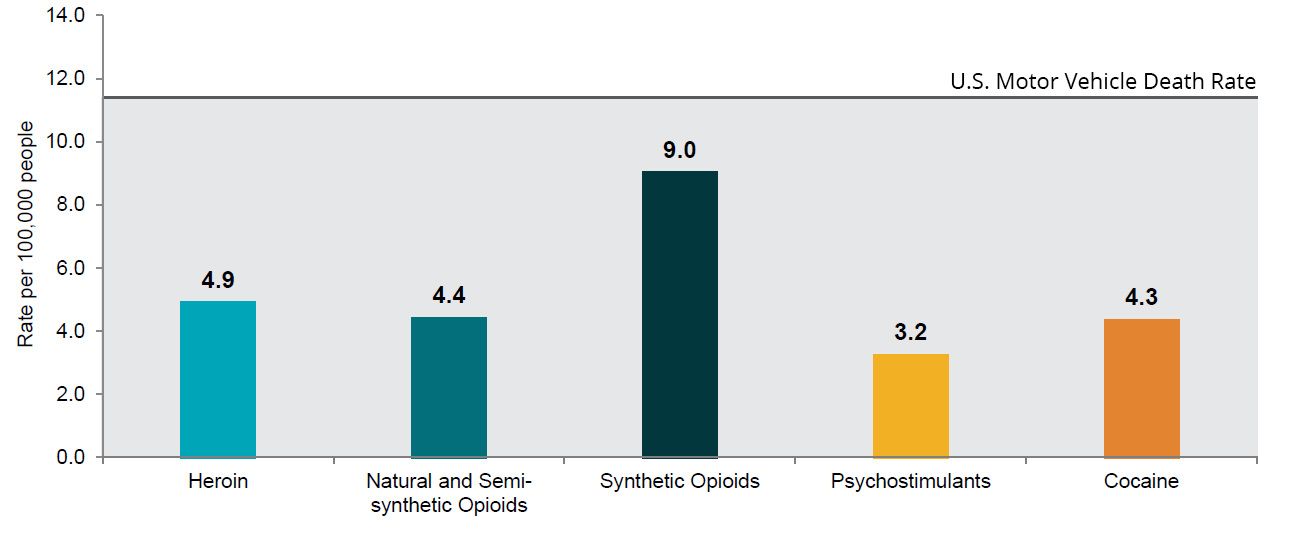
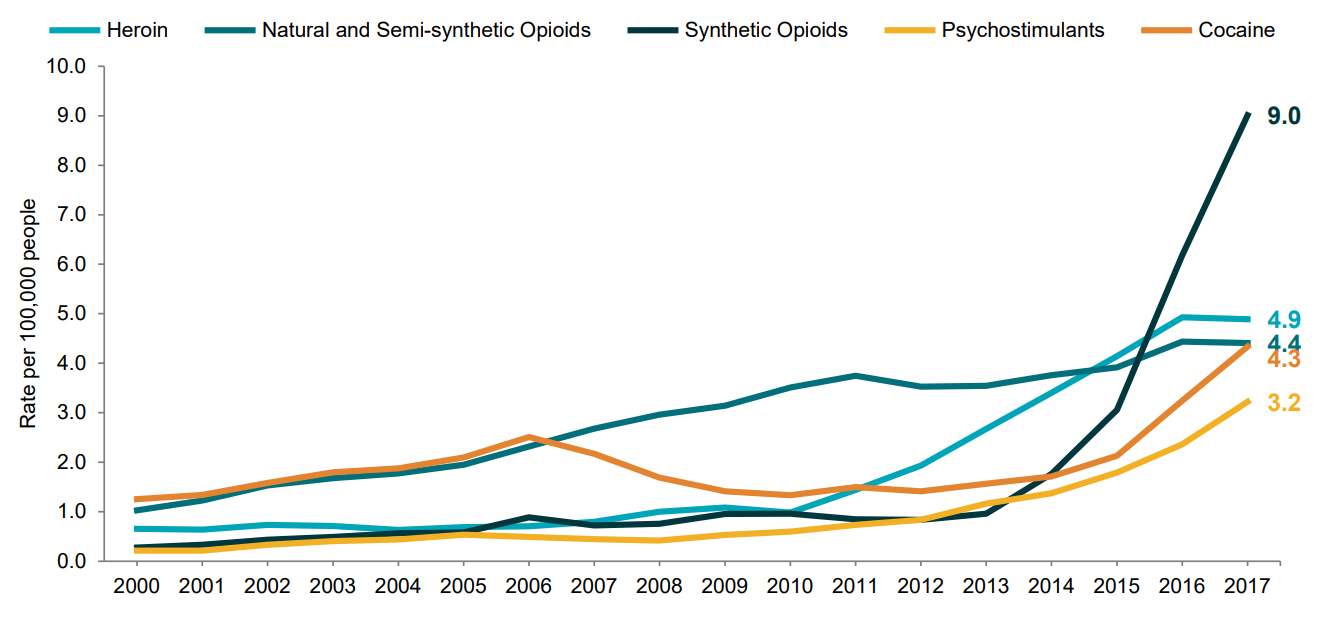
The set of infographics for each state display their findings in chart format made available to view or download by state via an interactive map. All state level data outlines trends in drug overdose deaths per 100,000 people by drug type including Heroin, Natural and Semi-synthetic Opioids, Synthetic Opioids, Psychostimulants and Cocaine. In addition, the data presented offers a high-level comparison between the states, showing the number of drug overdose deaths compared to deaths caused by motor vehicle accidents during the same time frame. The information is also made available presenting data for the United States as a whole (presented below).
Trends in Drug Overdose Deaths per 100,000 people, by Drug Type (United States/2000-2017)
Drug Overdose Deaths (United States/2000-2017) With Comparison To Motor Vehicle Death Rate